DataPower: Enabling troubleshooting probe in New UI
Hello Tech Enthusiasts 👋,
As we all know by now, our beloved WebGUI in DataPower will no longer be available beyond version 10.5.4 (something I’ll definitely miss). Previously, IBM introduced the Blueprint Console as a replacement, but it never quite lived up to expectations. Now, we have a new UI that we must adopt going forward.
I was a bit skeptical at first, especially since I was never comfortable using the earlier Blueprint Console — thankfully, it’s gone. But with the new UI, I must say, the moment I started using it, I was impressed. It’s damn fast compared to the existing UI! One reason for the shift is also that the existing UI consumes a lot of memory, which is why it’s not recommended to enable and use it in Kubernetes or OpenShift environments. I believe things are finally heading in the right direction.
Anyway, when it comes to enabling the probe from the new UI, the approach is slightly different.
Difference in existing WebGUI probe vs new UI probe
| Item | WebGUI | New UI |
|---|---|---|
| Enabling Probe | We can enable directly from Service or from Troubleshooting Probe. No pre-setting needs to be enabled. | We first need to enable gateway-peering , following with probe setting. Then we can enable probe which also needed to add capture setting. |
| Disabling Multiple Probes | We cannot disable multiple probes at once. We would either need to disable one after the other manually or need automation through SSH/SOMA. | We can disable by simple disabling the probe setting (we’ll talk about below). |
| Flush Probe Record | We can flush the probe to clear our all the recorded transactions. | In new UI, the one way is to delete and create a new probe capture. |
| Modify Probe Setting | We can edit the probe setting to capture only particular transactions. | We need to create new capture probe every time and delete the existing (if required) we need to modify. |
| Performance | Slow, compare to new UI | Quite fast as compare to traditional WebGUI probe |
Steps for enabling probe in New UI
1.) As default, the probes are in disable state. This is because it’s dependant on probe setting. If you logon to DataPower Homepage > Monitoring & Troubleshooting > Troubleshooting > Probe, you’d notice all probes are greyed out 👇:
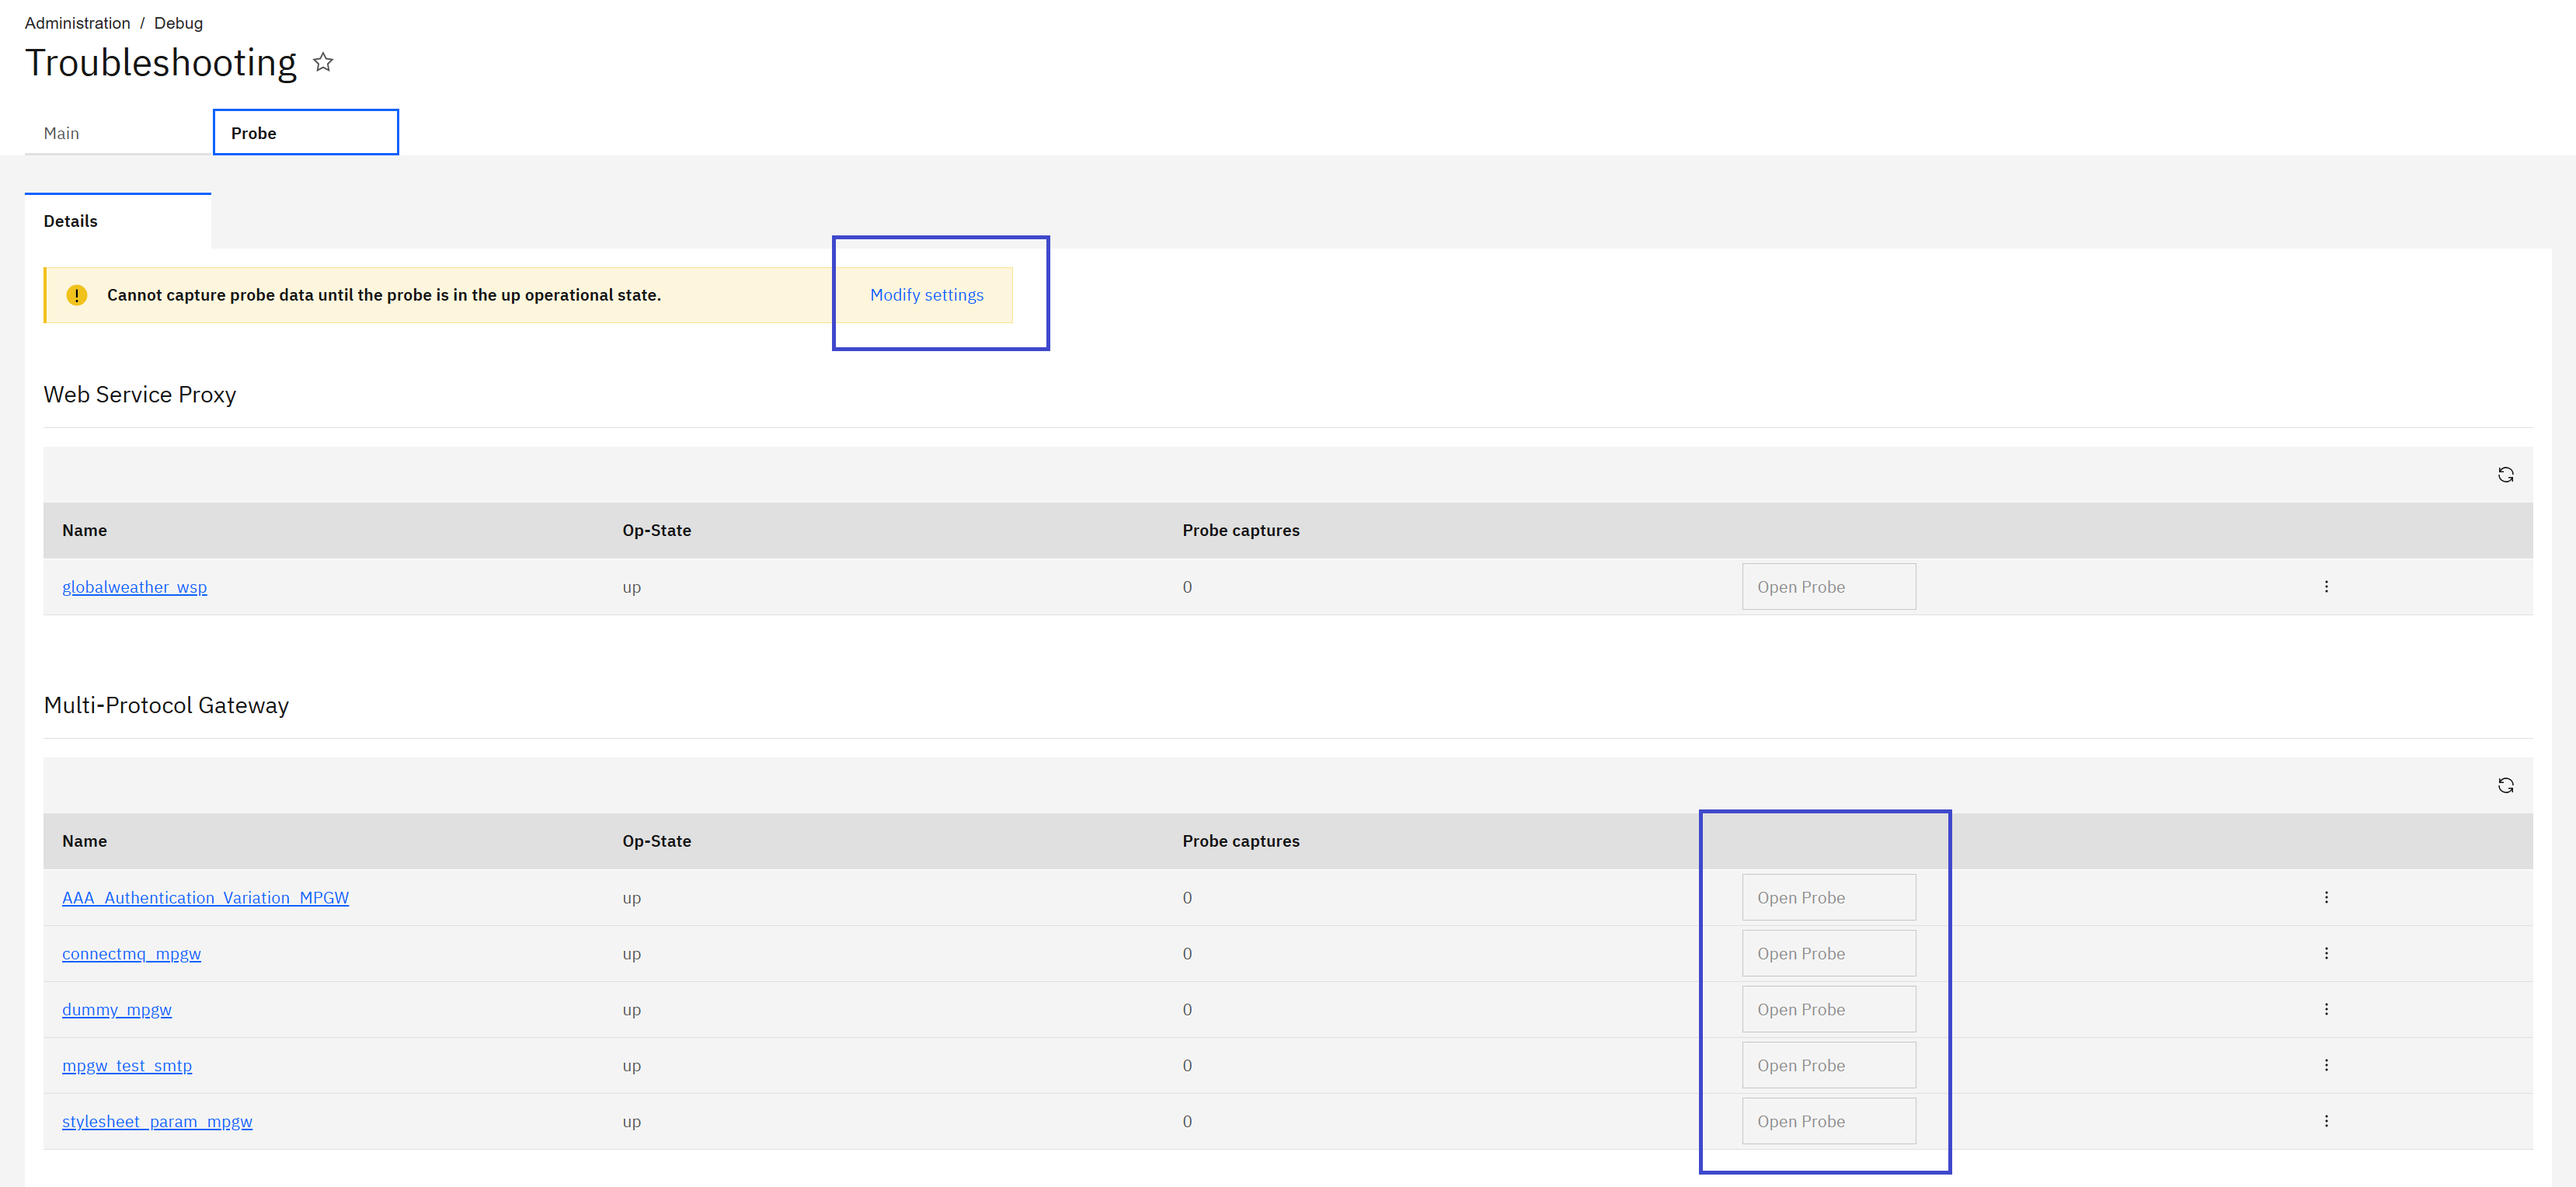 Default Probe Page
2.) You can either directly click on Modify setting or search ‘Probe’ in search bar and select ‘Probe Setting’
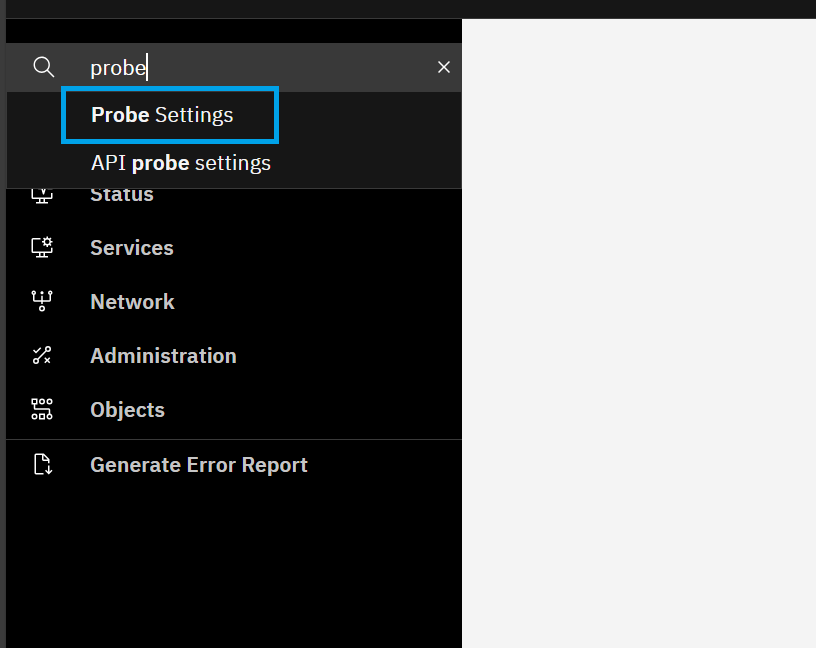 Search Probe Setting
3.) Click on edit ‘default-gateway-peering’ 👇:
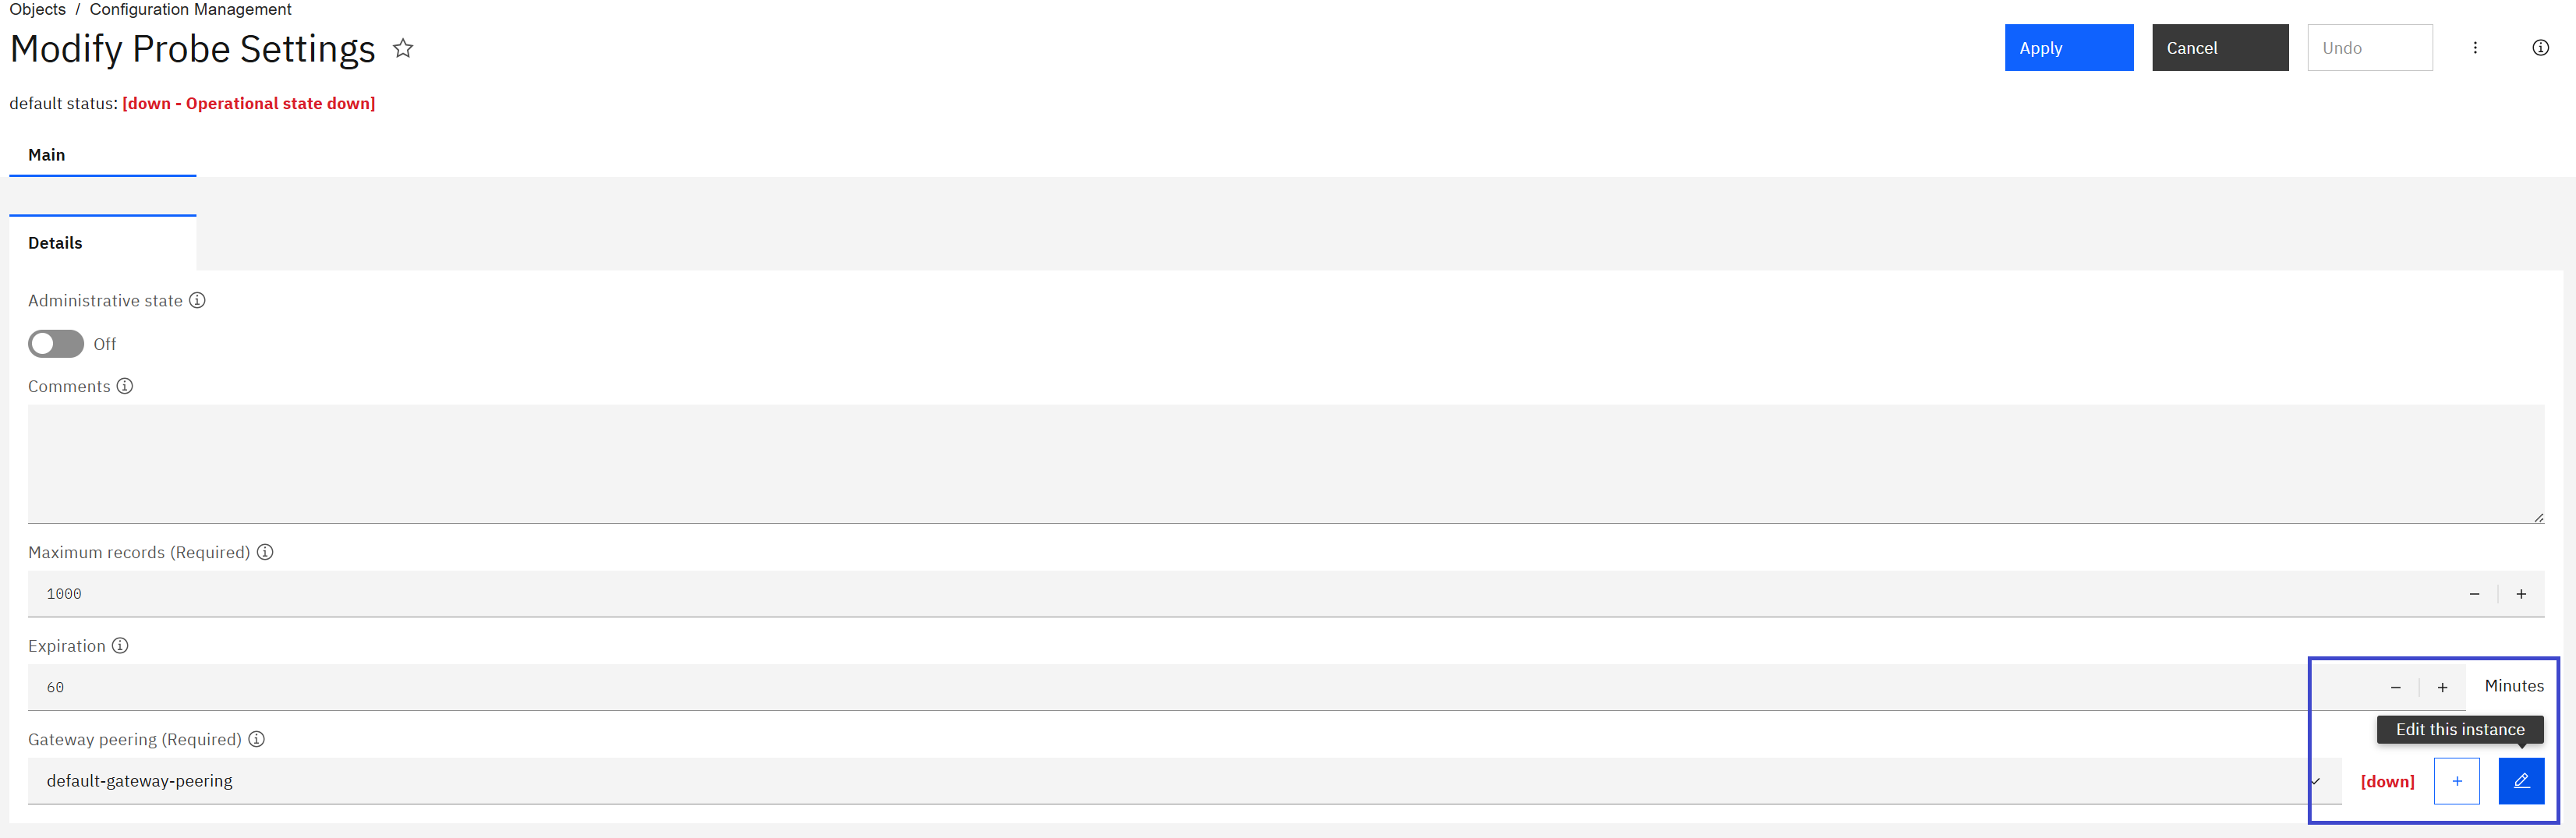 Default Probe Setting Page
The gateway peering instance is useful to synchronize the captured transaction data. This is much useful in case of IBM API Connect.
4.) Enable gateway-peering 👇. Ensure to modify the configuration like ports / local-address. If there is multiple DataPower domain, ensure to change the port# to a unique value.
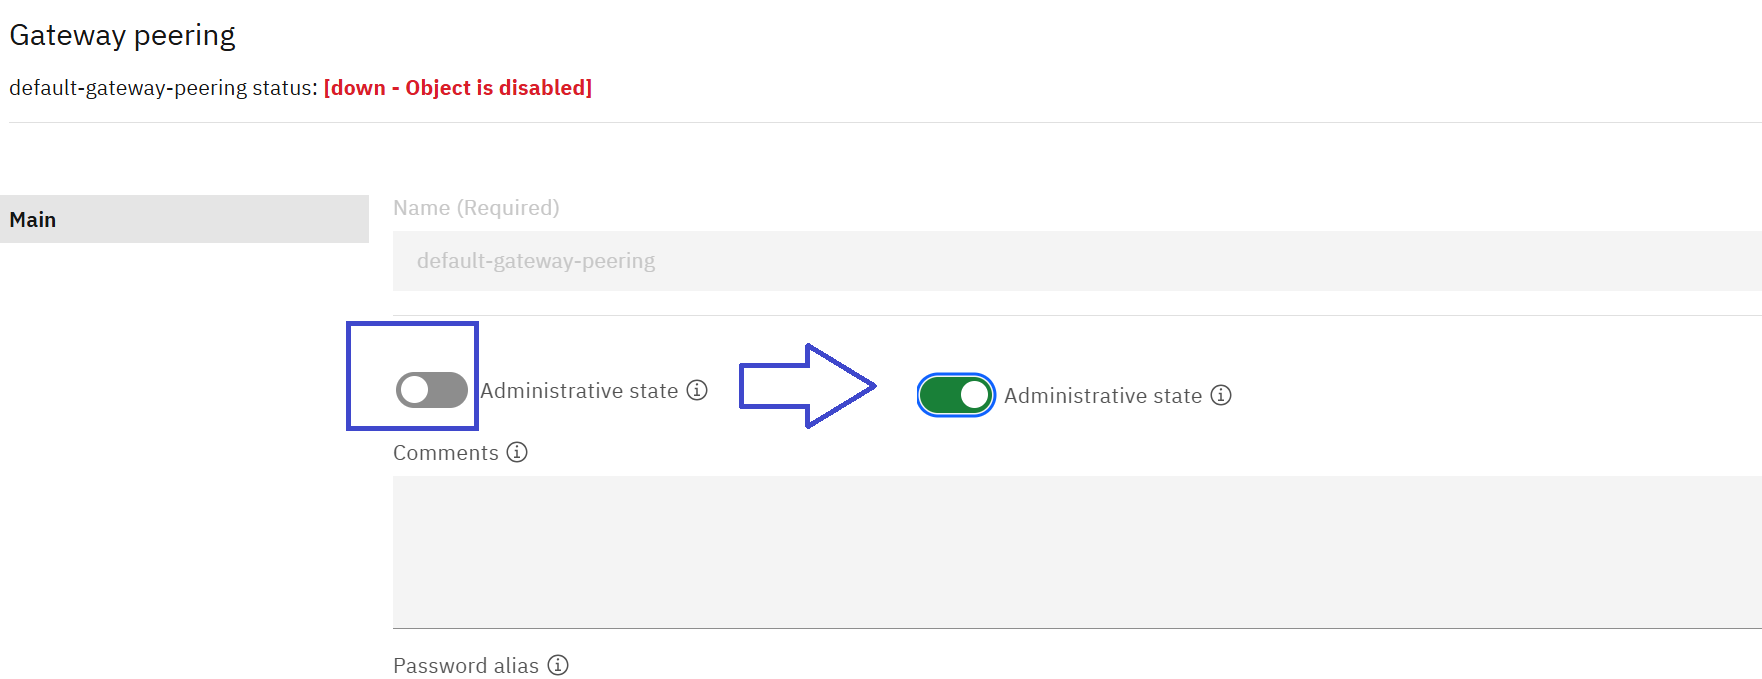 Gateway Peering Page
5.) Enable Probe Setting and Apply/Save the config 👇:
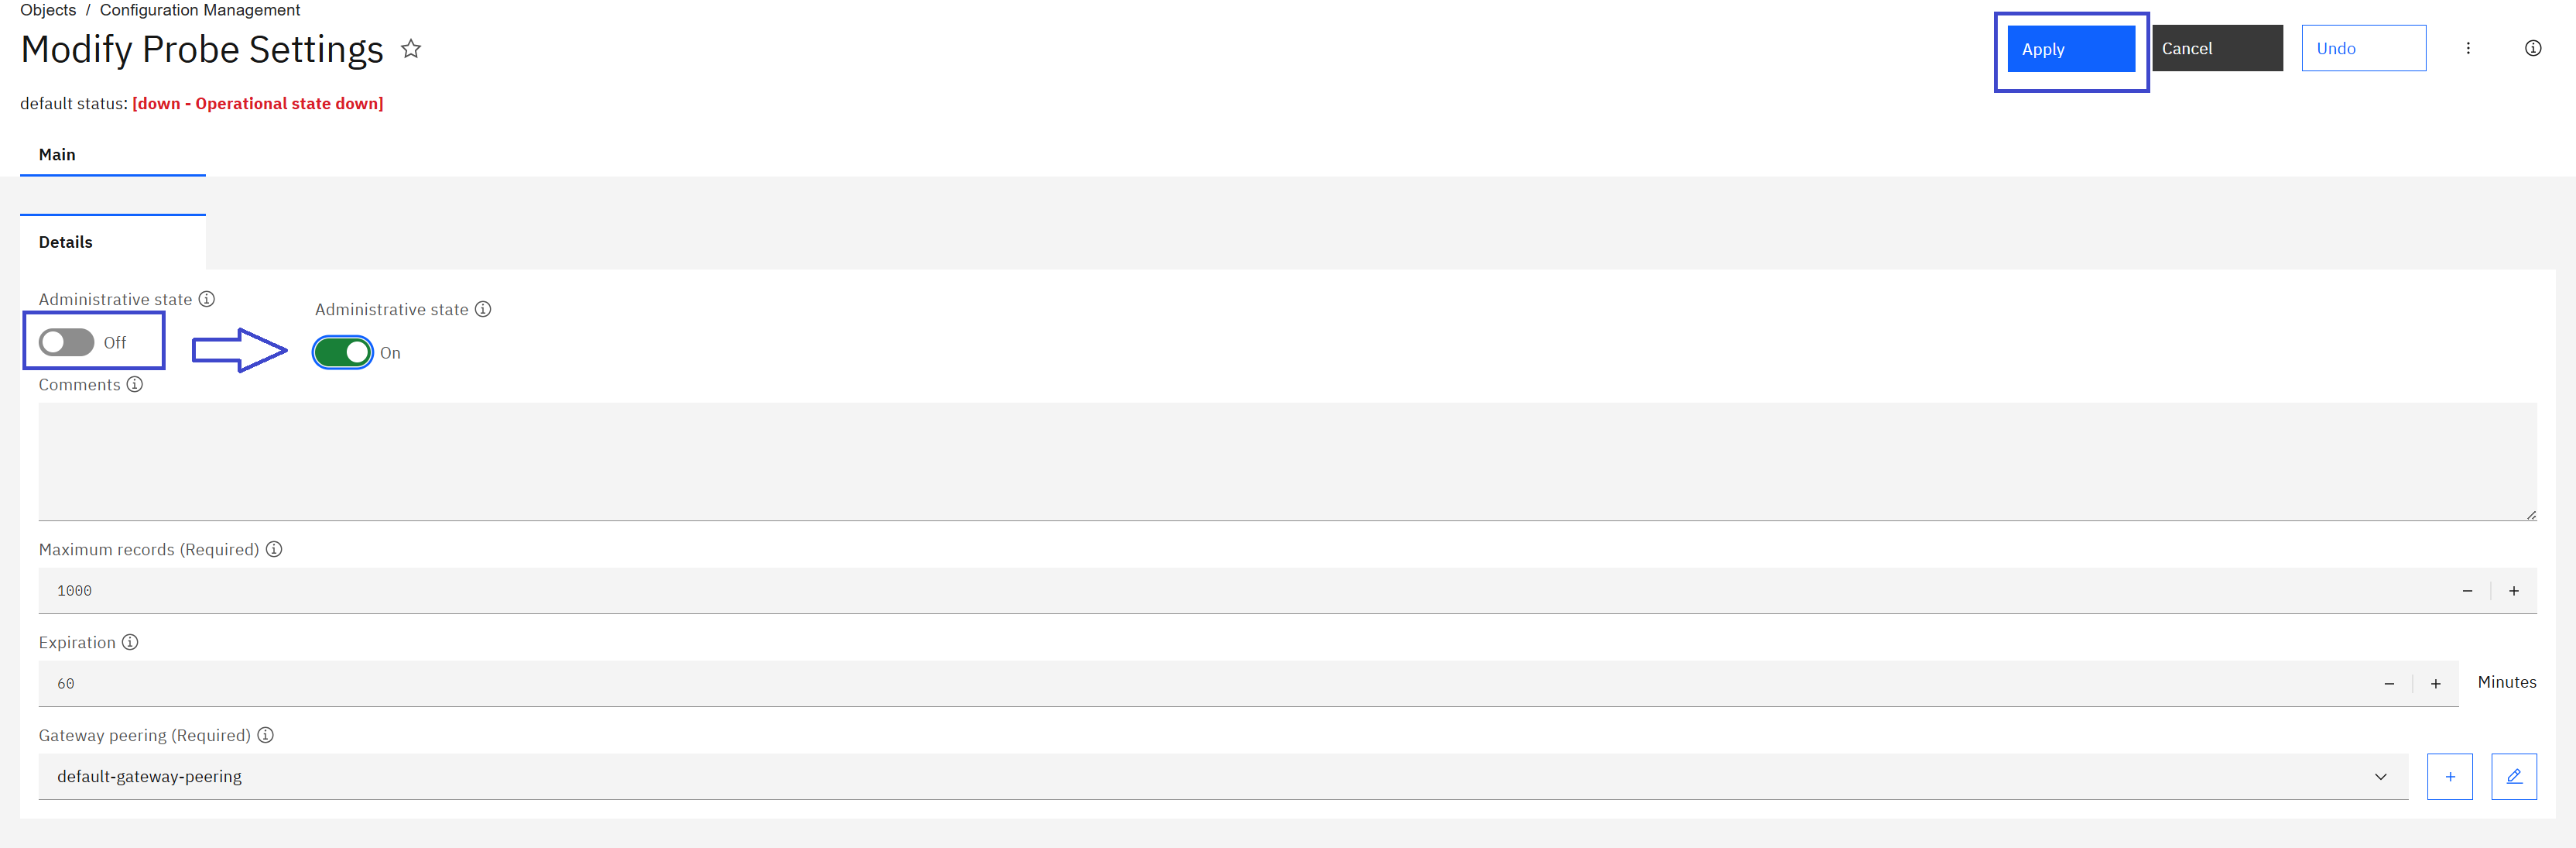 Enable Probe Setting
6.) Follow DataPower Homepage > Monitoring & Troubleshooting > Troubleshooting > Probe. Now you should see all ‘Open Probe’ icon now available. Select the probe that needs to capture : 👇
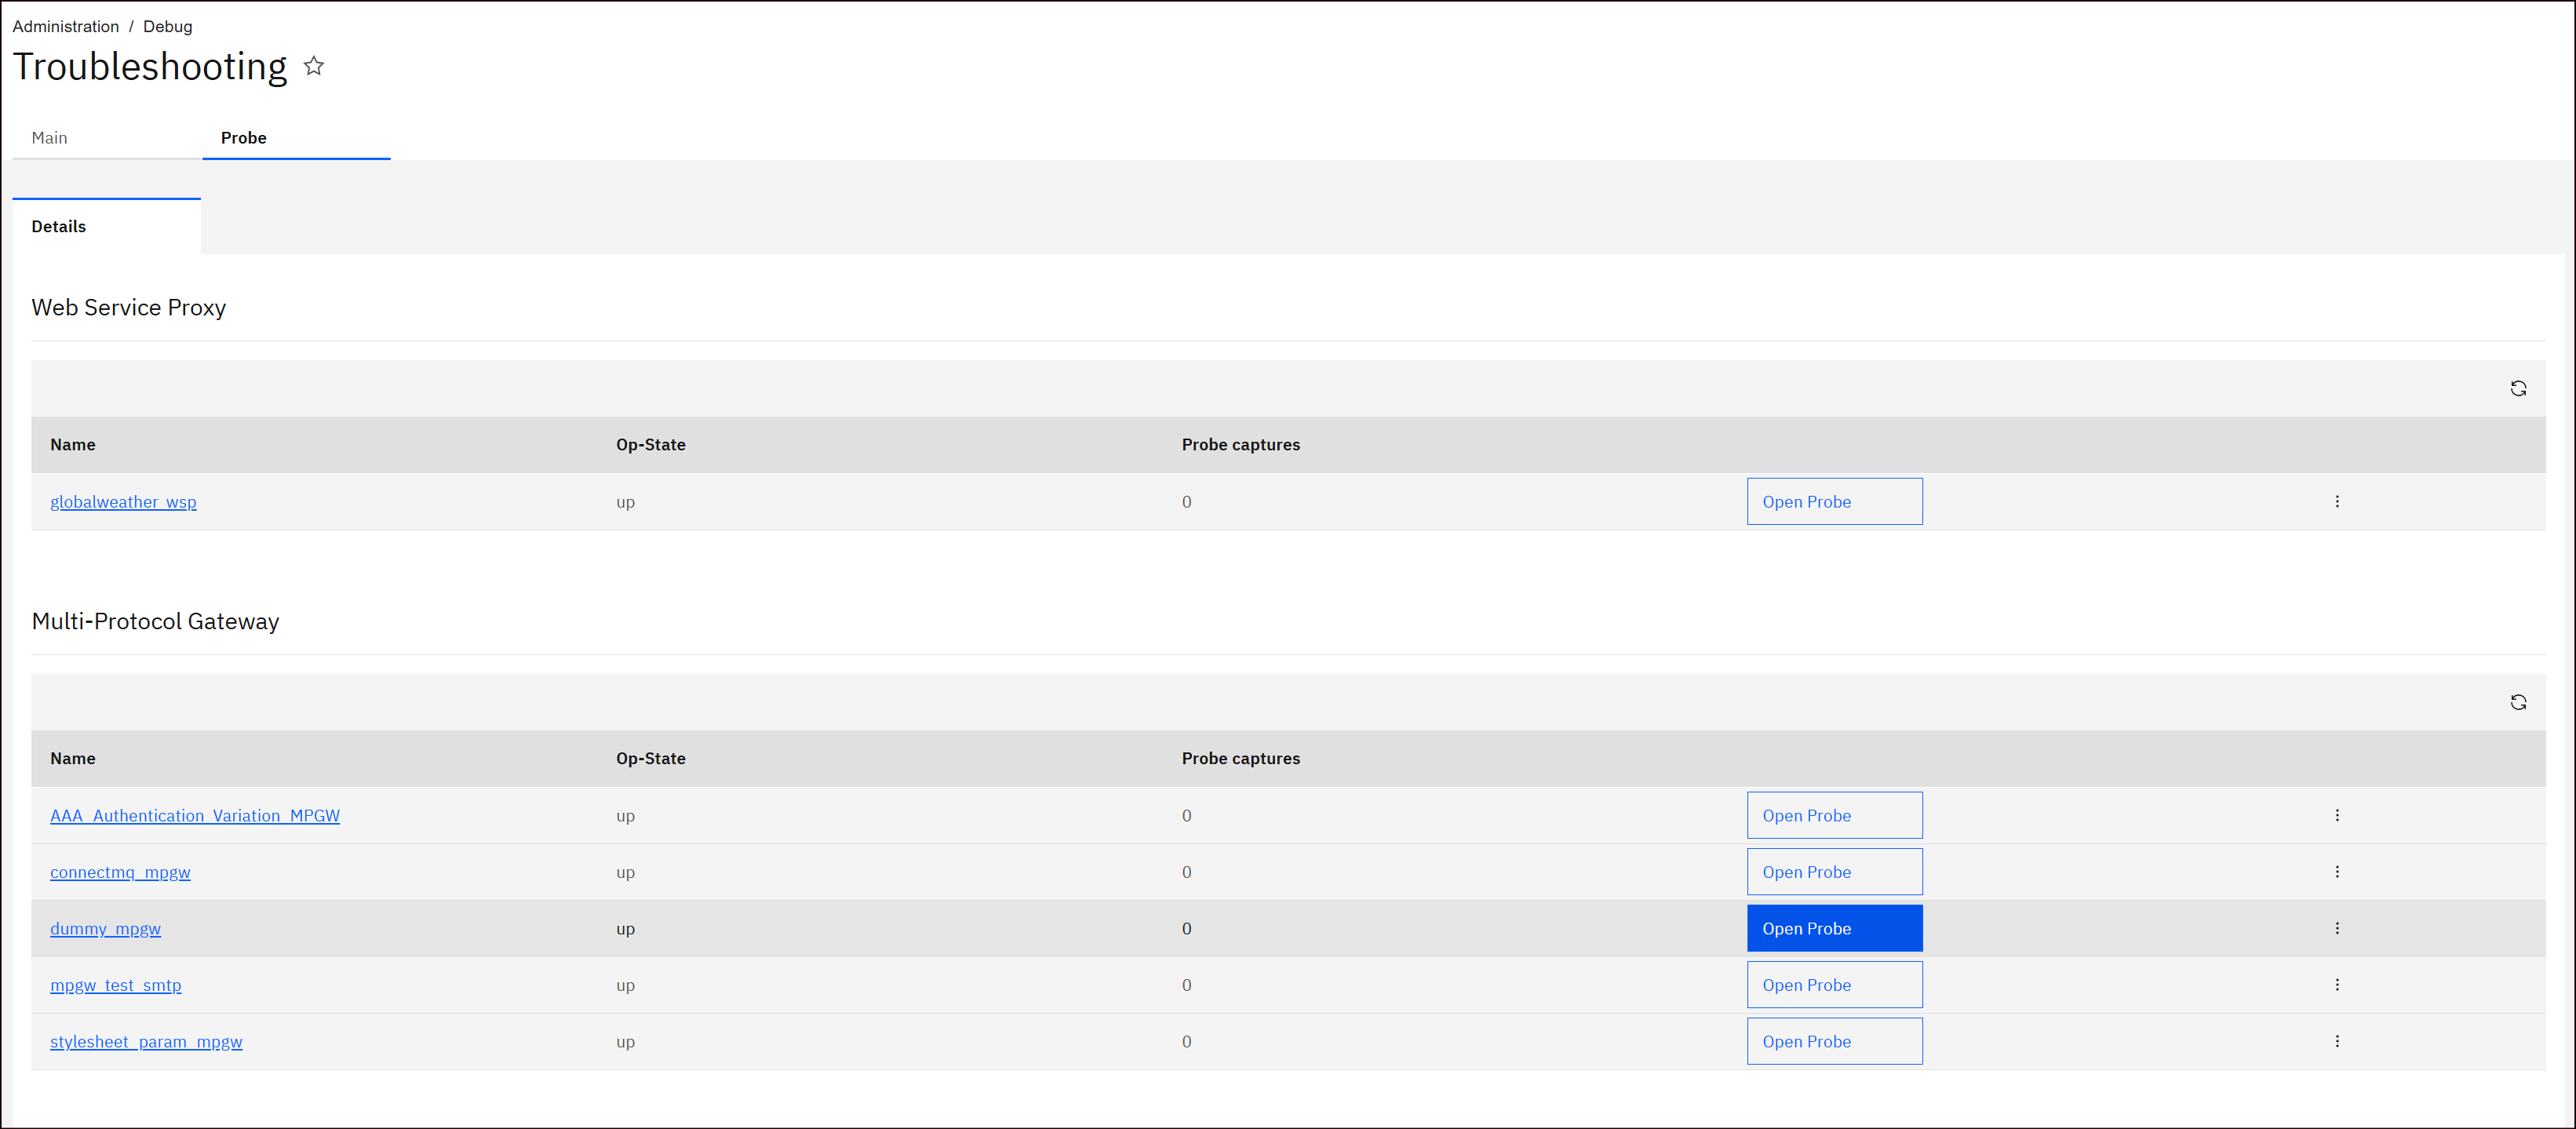 Troubleshooting Probe Page
7.) After selection, we see following screen 👇:
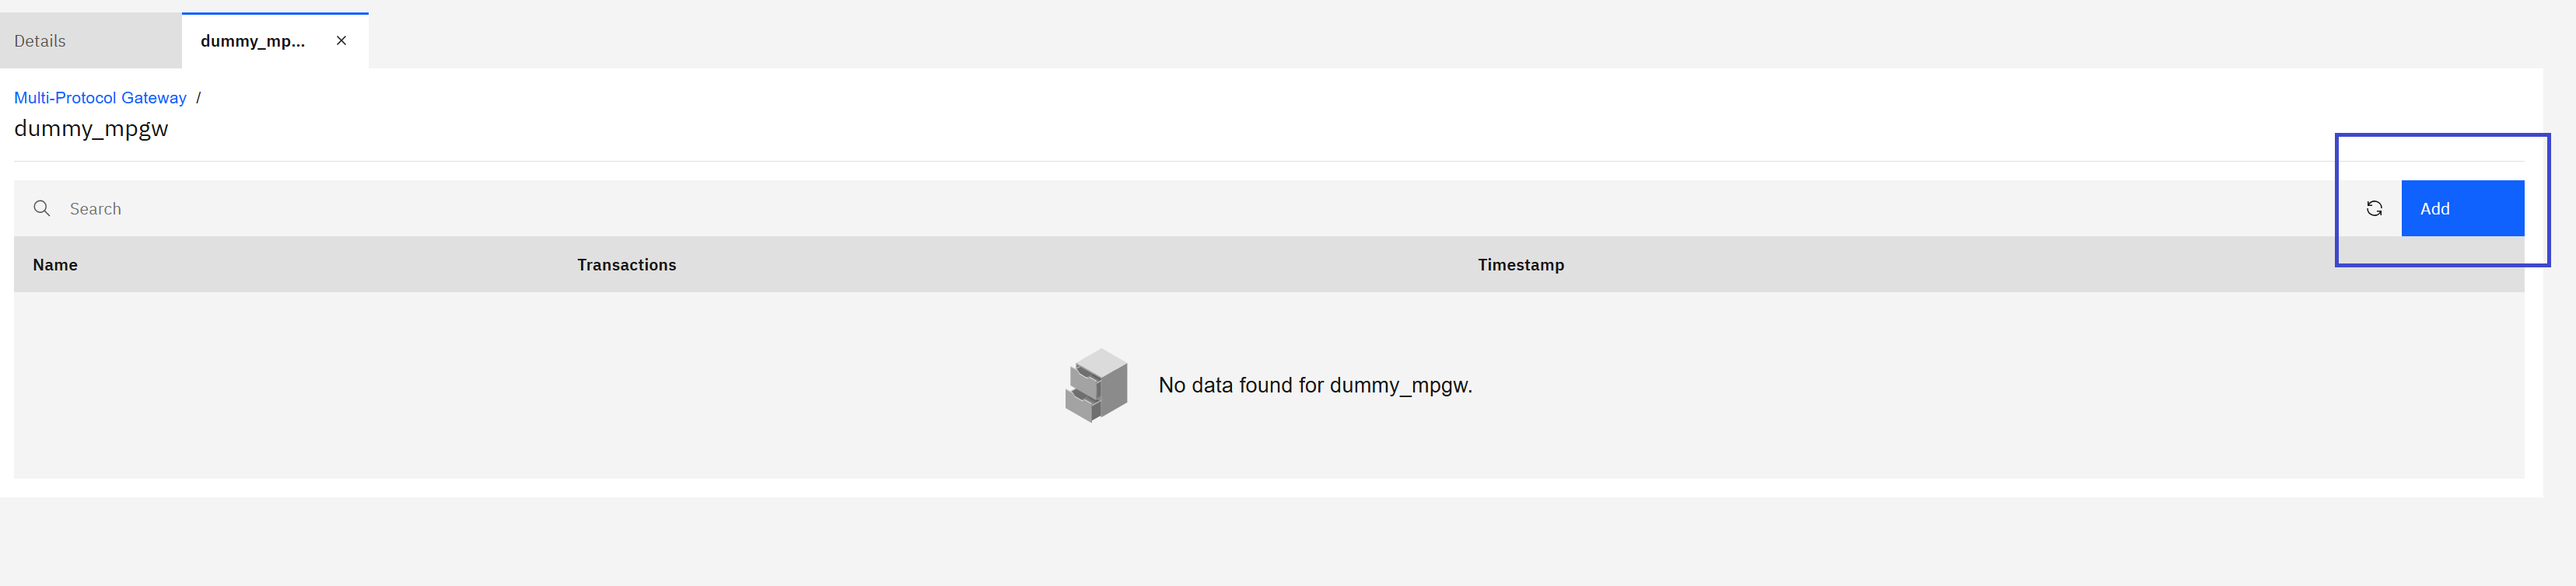 Service Probe Screen
8.) Create probe capture. Enter Name e.g: ‘capture_all’ , capture count e.g. 50 and leave Interval as 0: 👇
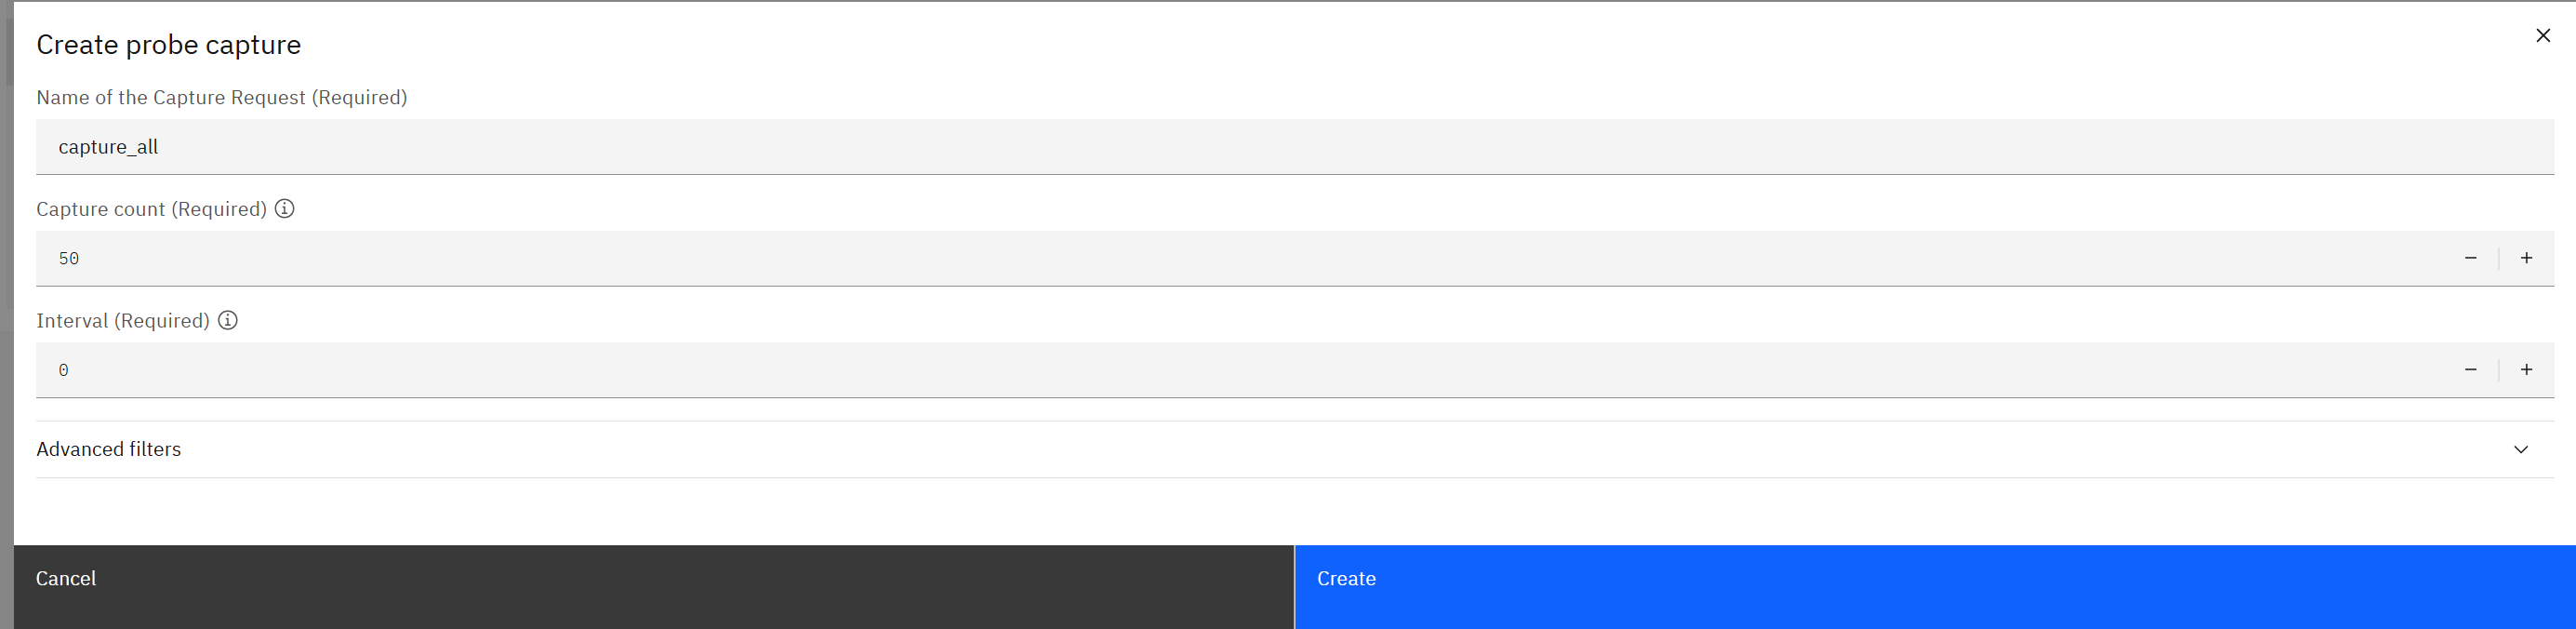 Create Probe Capture
9.) Hit the service, that should create the capture count. 👇
 Capture Probe Count
10.) Select the probe above and that should take to the list of transaction ID. Similar to WebGUI probe
![]() Transaction list
Transaction list
11.) Select the particular transaction which would take you to transaction debug (similar to WebGUI transaction debug)
![]() Debug Transaction
Debug Transaction
— Keep Learning 😊
— Aditya Singh
If this article helped you in someway and want to support me, you can …